Grapher
Source Code: https://github.com/rohanphanse/grapher
Live Demo: https://rohanphanse.github.io/grapher
Grapher
I love Desmos and use it all the time, but I was disappointed when I found out they didn't support slope and vector fields. So I decided to take on the challenge and code my own graphing calc with the desired functionality. After a lot of hard work and some intense mathematics 🙂, I'm proud to present the result, Grapher!
Features
- Graph functions, slope fields, vector fields, polar, and parametric
- Zoom in and out (with animations 🥳)
- Beautiful rendering on Javascript canvas
- Powerful and intuitive syntax
- Set custom domain for polar and parametric graphs
Guide + Demos
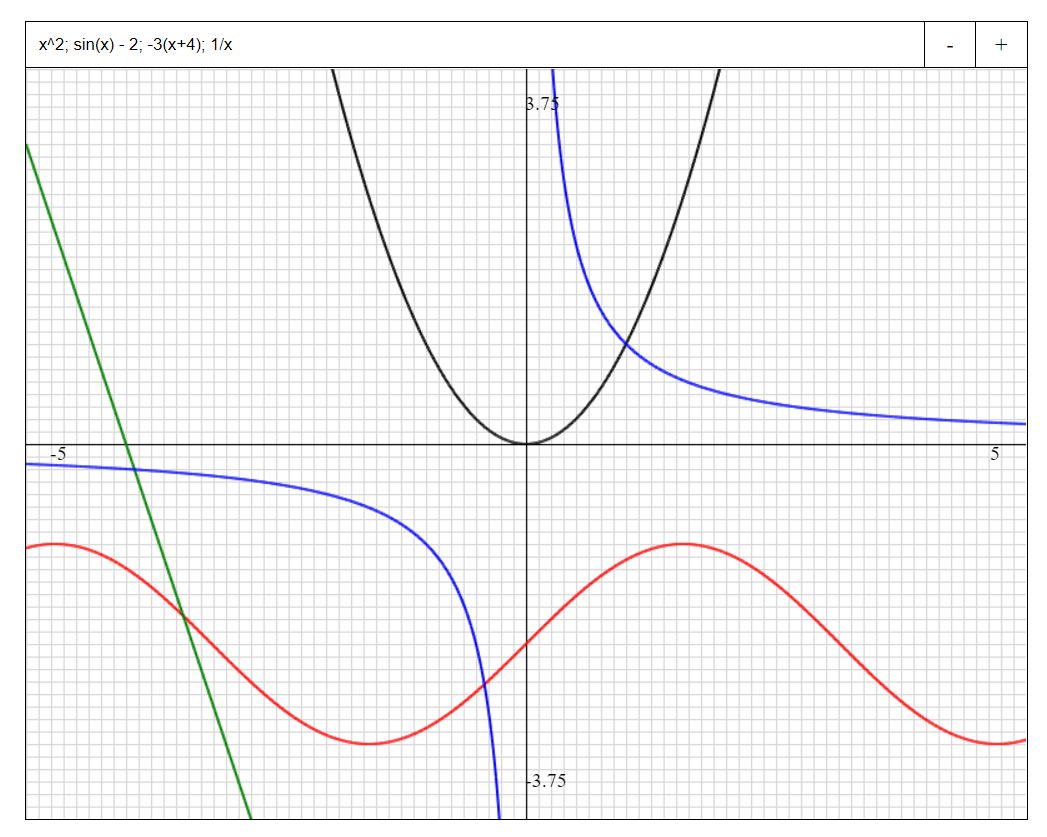
Functions: Enter a function f(x) by writing any expression with the x variable. Separate multiple graphs with semicolons.
For this demo, I've graphed the parabola x^2, the sine curve sin(x) - 2, the line -3(x + 4), and the function 1/x.
I'm using the wonderful math.js library for evaluating math expressions. Here are a few useful functions and constants you can use in Grapher.
- Trig functions:
sin(x),cos(x),tan(x),sec(x),asin(x)(inverse sine), ... - Square root:
sqrt(x) - Natural logarithm (base e):
log(x) - Constants:
pi,e
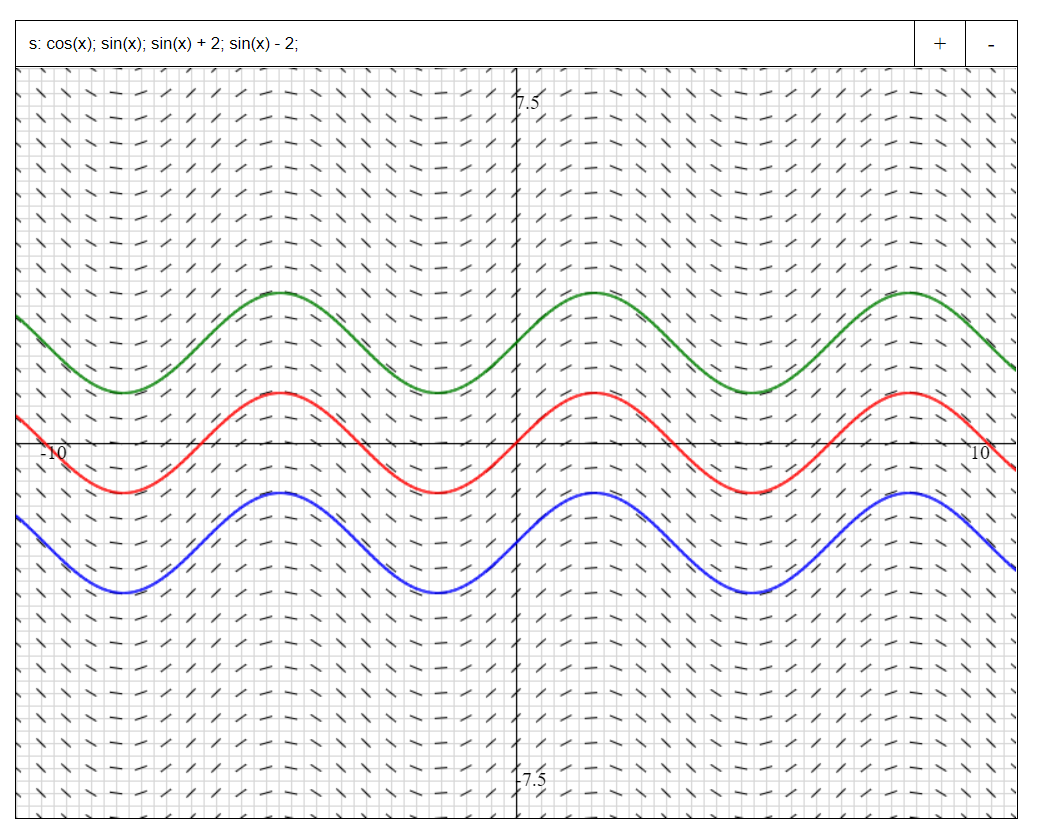
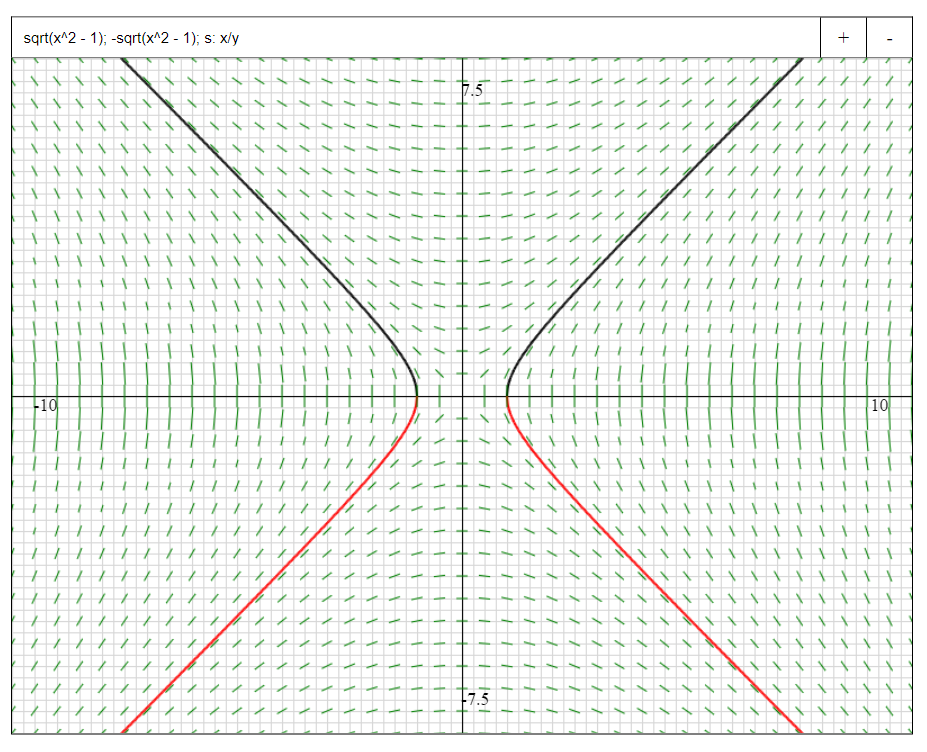
Slope Fields: Start off with the prefix s: and enter an expression in terms of x and y.
For this demo, I'm graphing the family of sine curves sin(x) + C and the slope field of cos(x). I've also included a hyperbola x^2 - y^2 = 1 and the slope field x/y.
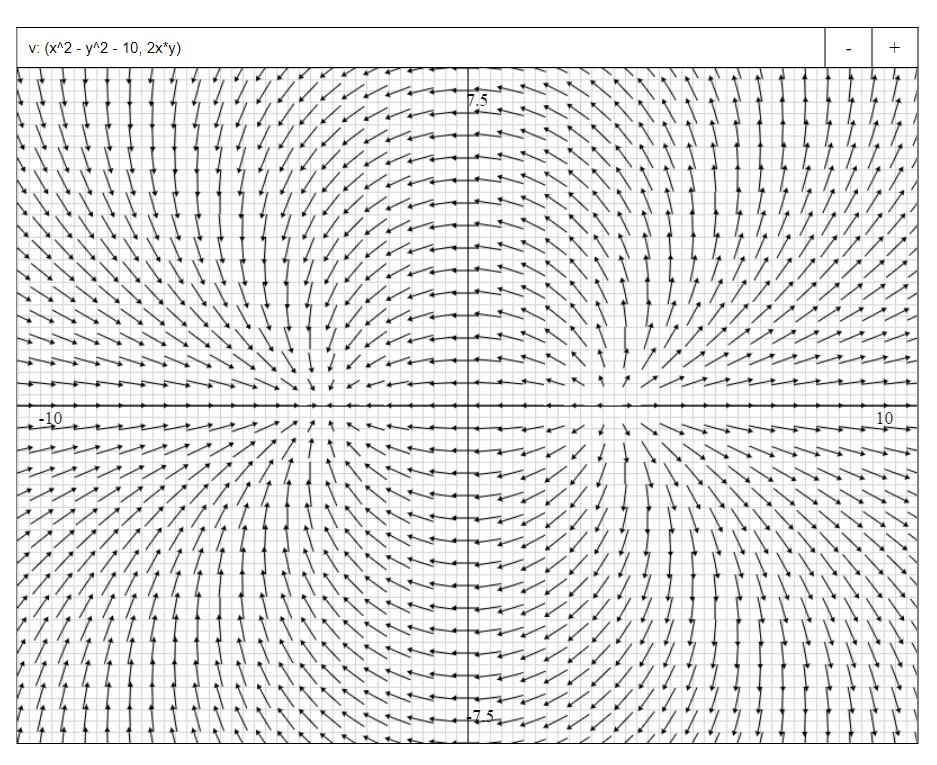
Vector Fields: Use the prefix v: and enter an expression in the form of v: (f(x, y), g(x, y)). The 2 functions of x and y inside the paranetheses are the x- and y-components of the vector.
For this demo, I've graphed a dipole vector field, which represents the electric field lines between a positive and negative charge in physics.
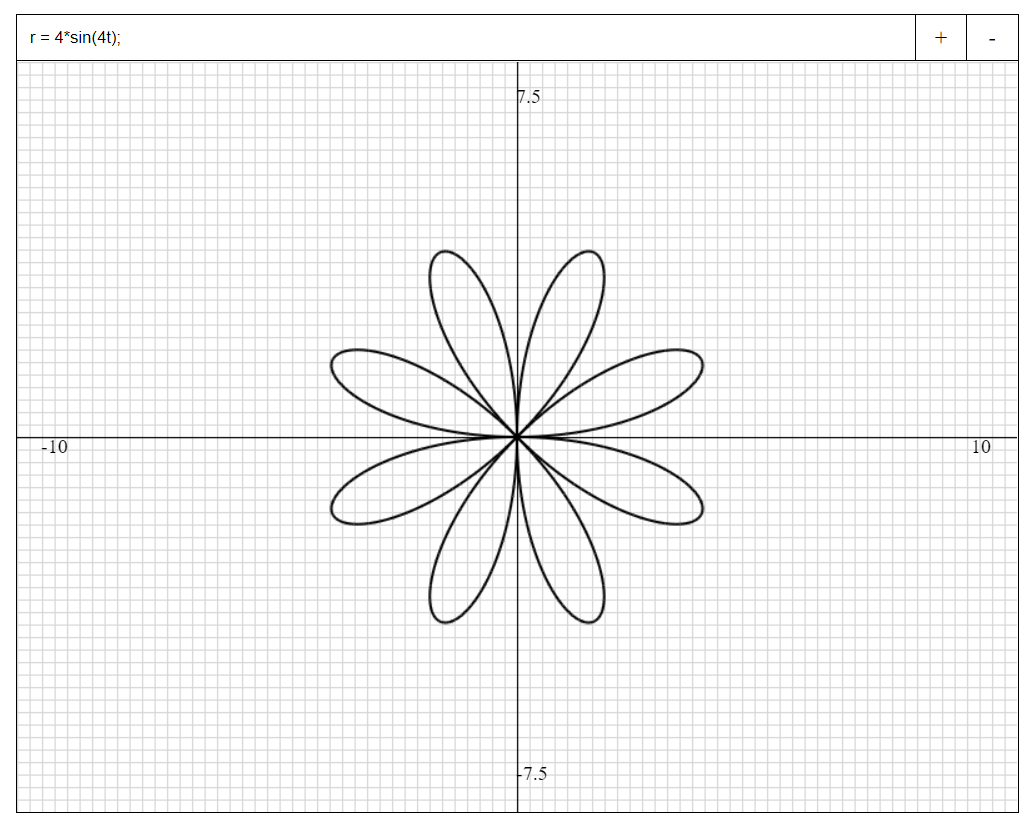
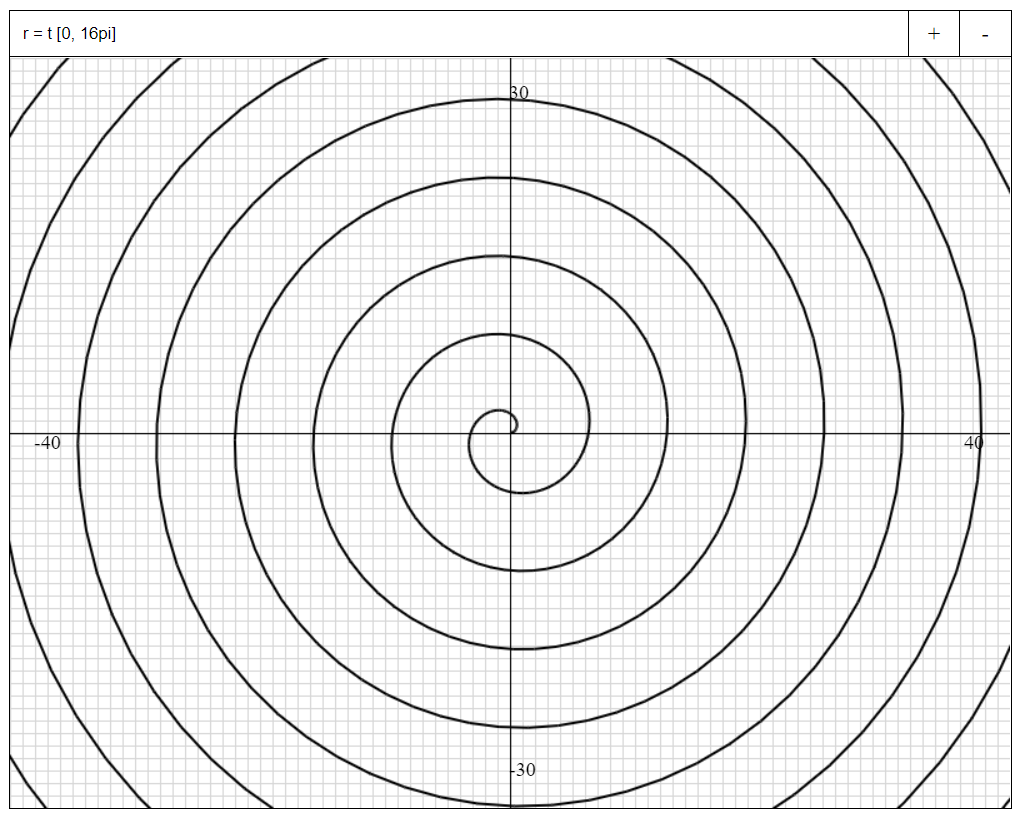
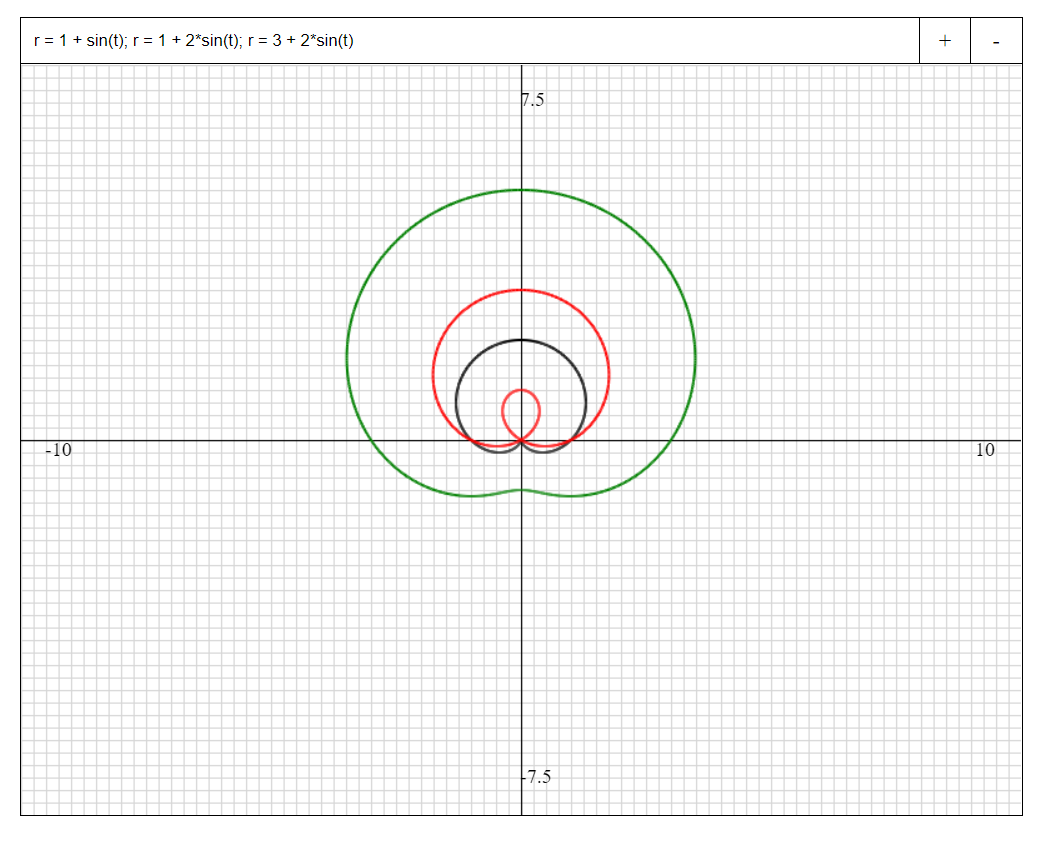
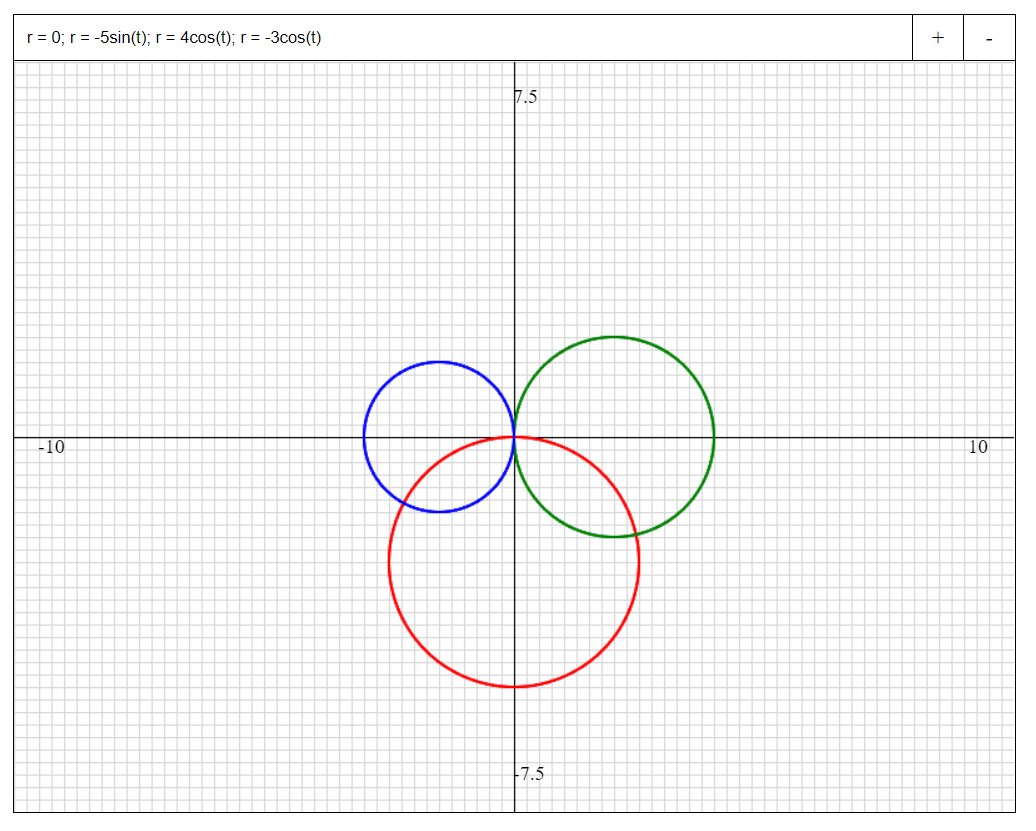
Polar: Use the prefix r = and enter an expression in the form of r = f(t).
For this demo, I've graphed 4 polar curves:
- Rose curve:
r = sin(4t)(8 petals) - Archimedes spiral:
r = t [0, 16pi](setting custom t-domain, default is[0, 2pi]) - Limaçons:
r = 1 + sin(t)(cardioid),r = 1 + 2sin(t)(inner loop), andr = 3 + 2sin(t)(dimpled)r = 0; r = -5sin(t); r = 4cos(t); r = -3cos(t)
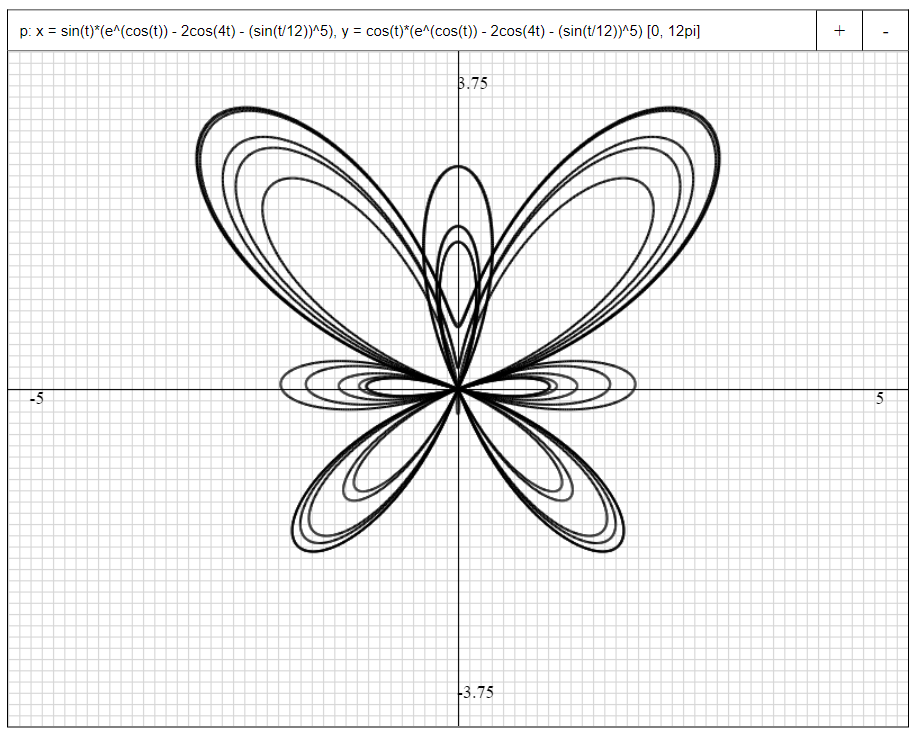
Parametric: Use prefix p: and enter in form of p: x = f(t), y = g(t).
For this demo, I've graphed the beautiful butterfly curve. Because this curve is so intricate, I upped the numbers of intervals from 1,000 (default) to 10,000.
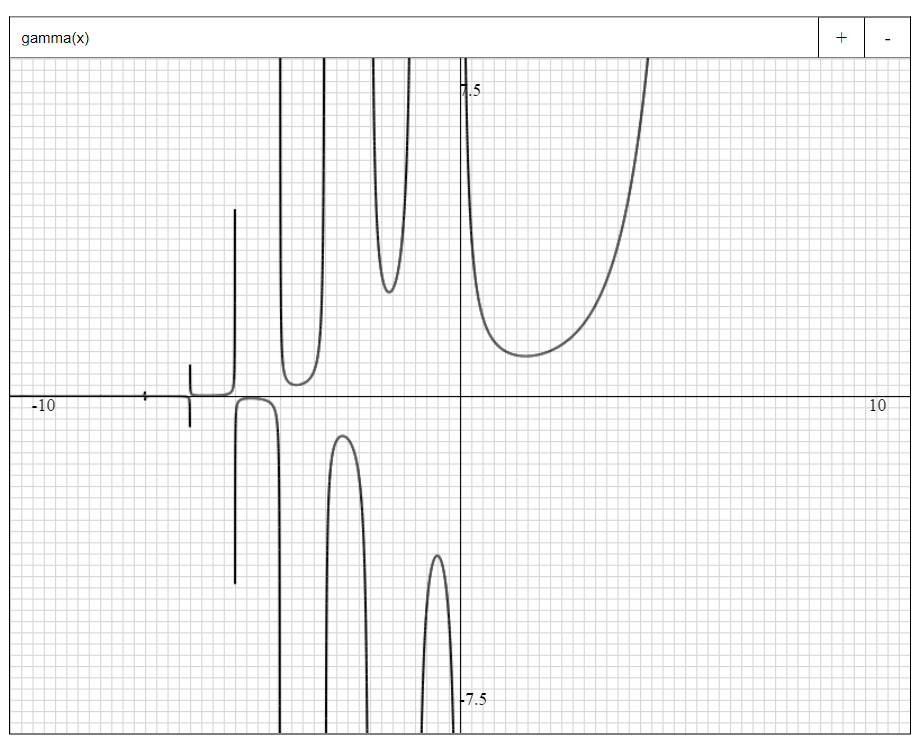
Bonus: Gamma function, the continuation of the factorial function to decimal and complex numbers (graphed with 10,000 intervals).
Featured Code
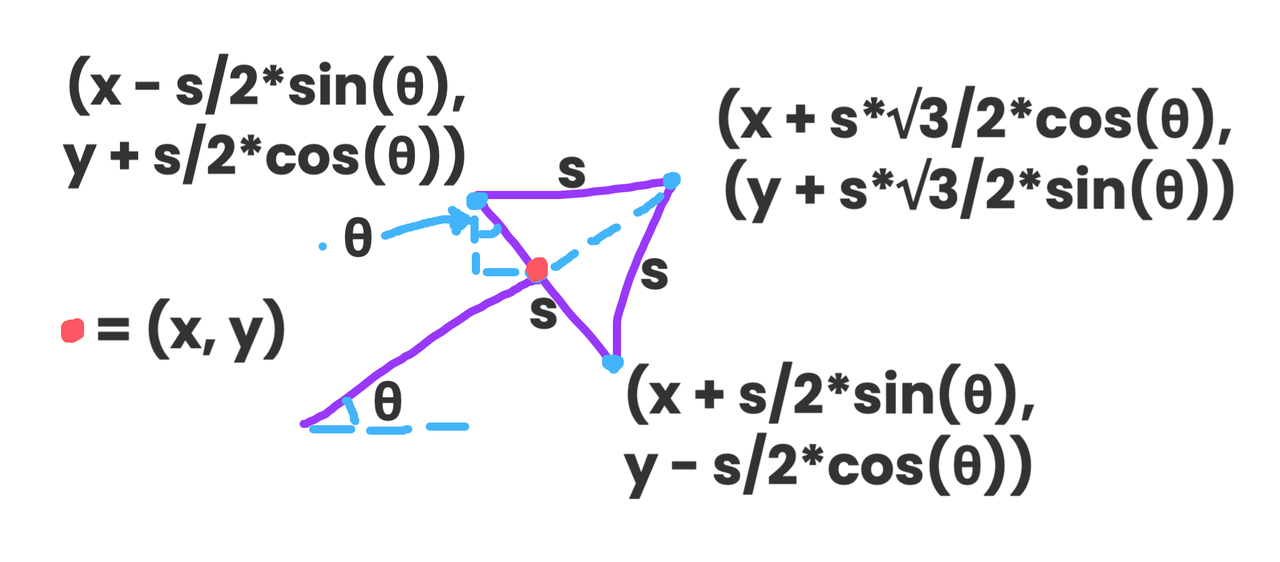
The code below constructs a rotated equilateral triangle at the endpoint of a vector. I use this function to help construct vector fields.
// /js/grapher.js; lines 394-405
drawVectorTriangle(point, vector) {
    const angle = Math.atan(vector.y / vector.x)
    const side = 5
    // Draw rotated vector triangle on canvas
    this.ctx.beginPath()
    this.ctx.moveTo(point.x, point.y)
    this.ctx.lineTo(point.x - side/2 * Math.sin(angle), point.y - (side/2 * Math.cos(angle)))
    this.ctx.lineTo(point.x + side*Math.sqrt(3)/2 * Math.cos(angle) * Math.sign(vector.x), point.y - (side*Math.sqrt(3)/2 * Math.sin(angle)) * Math.sign(vector.x))
    this.ctx.lineTo(point.x + side/2 * Math.sin(angle), point.y + (side/2 * Math.cos(angle)))
    this.ctx.fill()
}
To construct the rotated equilibrium triangle, the code determines the three vertices of the triangle using a given point (x, y) and an angle θ, and draws it on the HTML canvas. Here is a diagram of the math I did to write this code:
And that's it! Thanks for checking out my project and use Grapher to visualize whatever your heart desires!